How to read an electrical steel B-H curve
The B-H curve is the fundamental characterisation of a magnetic material. Learning to read it tells you how a steel grade will behave in your motor core — before you commit to a design.
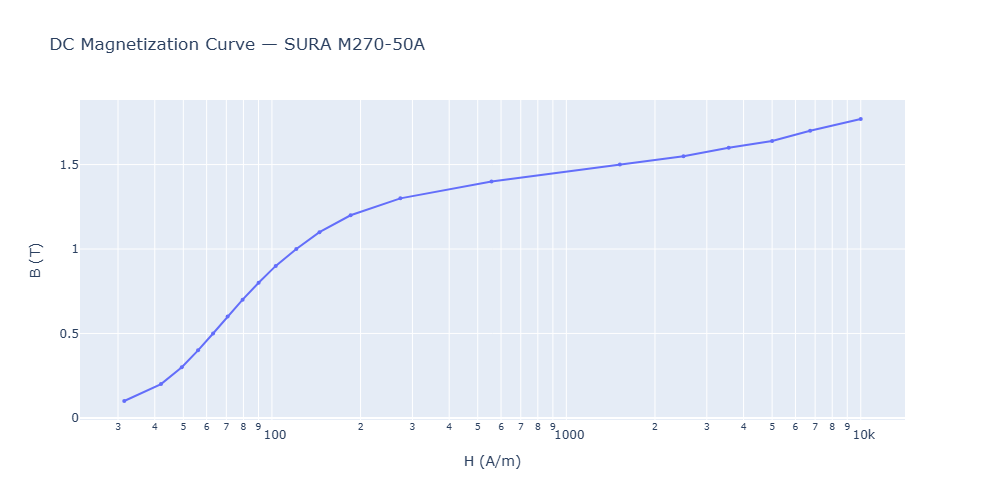
What the axes represent
The horizontal axis is magnetic field intensity H, measured in A/m. This represents the driving force — how much magnetising current you are applying per unit length of the magnetic circuit. The vertical axis is magnetic flux density B, measured in Tesla. This is the response — how much flux the material carries as a result of that excitation.
The relationship between B and H is not linear, and it is not constant — it depends on the history of the material's magnetisation. That non-linearity is what makes motor core design non-trivial.
The three regions of the curve
Linear region: At low field intensities, B increases approximately proportionally with H. The slope in this region is the initial permeability μ, and this is where the material behaves most predictably. Most motor cores operating under light load conditions stay in this region.
Knee region: As H increases further, the rate of increase of B slows. The magnetic domains within the material are becoming aligned, and the material is approaching its capacity to carry flux. The knee is where most well-designed motor cores operate at rated conditions — pushing slightly into the knee to maximise flux density while keeping losses manageable.
Saturation region: Beyond the knee, B increases very slowly regardless of how much H is applied. The domains are fully aligned. Operating a motor core in deep saturation means dramatically increased magnetising current for little additional flux — a poor trade-off in terms of copper loss and efficiency.
The hysteresis loop
When you apply an alternating field — as happens in every AC motor — the B-H curve traces a closed loop called the hysteresis loop. The area enclosed by this loop is proportional to the energy dissipated as heat per magnetisation cycle per unit volume. This is hysteresis loss, and it scales with frequency.
A narrow loop (low coercivity) means low hysteresis loss. Grain-oriented electrical steels are manufactured specifically to achieve narrow loops in one direction — making them ideal for transformer cores but less suitable for rotating machines where flux rotates in all directions.
What to look for when comparing grades
| Parameter | What it means | Prefer higher or lower? |
|---|---|---|
| B at H = 5000 A/m | Flux density at moderate excitation | Higher — more flux per amp |
| Bsat | Saturation flux density (~1.8–2.0 T for typical grades) | Higher — more headroom |
| Core loss at 1.5 T, 50 Hz | Iron loss at rated operating point | Lower — less heat, better efficiency |
| Thickness | Thinner laminations reduce eddy current losses | Thinner for high-frequency machines |
A common mistake is selecting the lowest-loss grade without checking the B-H curve shape. A grade with lower stated losses may also saturate at a lower flux density, forcing you to use more lamination material to achieve the same air-gap flux — offsetting the efficiency gain.
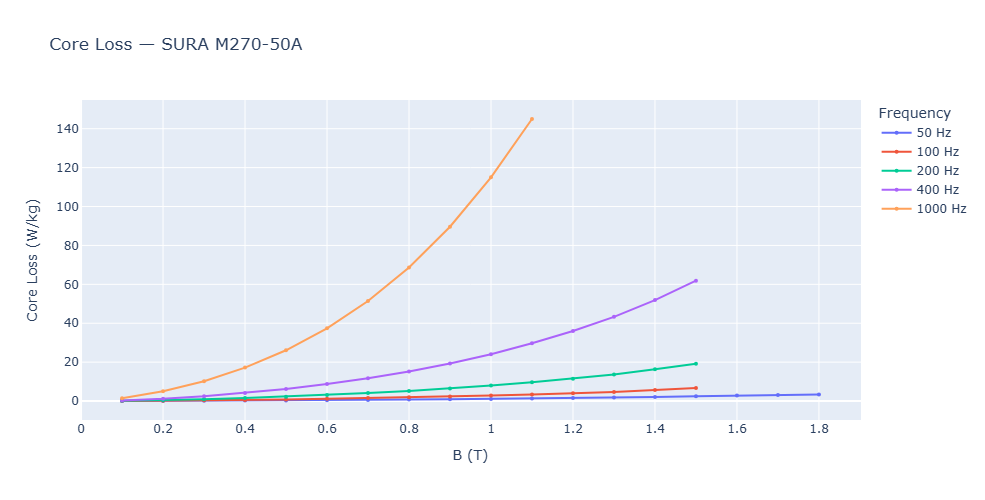
Frequency dependence
Core loss is not fixed — it depends strongly on the frequency at which the core is magnetised. Eddy current losses scale with f², while hysteresis losses scale with f. At 400 Hz (common in aerospace or high-speed spindle applications), core losses can be 50–100× higher than at 50 Hz for the same flux density. This is why high-speed machines use thinner laminations (0.1–0.2 mm) compared to standard industrial motors (0.5 mm).
Compare electrical steel grades interactively
Explore B-H curves and core loss data for grades from SURA, Thyssenkrupp, and Voestalpine at any flux density and frequency.